A text variable is a type of Calculated Variable in Porsline that allows you to categorise survey and form respondents and assign a text label to each group based on their answers.
Text Variables are useful in personality and psychological assessments, Net Promoter Score (NPS) surveys, customer satisfaction surveys, and other forms where respondents need to be grouped according to their responses or calculated results.
You can display these labels to respondents and view them alongside individual responses in the Results Table, making it easier to analyse results and identify different respondent groups.
In this guide, we'll explain how to use Text Variables in Porsline to categorise customers in an NPS survey into three groups: Detractors, Passives and Promoters.
Note: Calculated Variables, including text-based variables, are available on the Enterprise plan.
Use Text Variables to Categorise Customers in an NPS Survey
A Net Promoter Score (NPS) survey helps organisations measure how willing customers are to recommend their products or services to others.
The survey is based on a simple question:
“How likely are you to recommend our product, service or brand to a friend or colleague?”
Customers select a score from 0 to 10, where 0 means they are not at all likely to recommend the brand and 10 means they are extremely likely to do so.
Based on their answers, customers fall into three categories:
- Detractors (0–6): Customers whose scores may indicate dissatisfaction or an experience that requires further attention.
- Passives (7–8): Customers who give a moderately positive recommendation score.
- Promoters (9–10): Customers who are highly likely to recommend the brand to others.
Using Text Variables, you can automatically assign the appropriate category to each response without having to label every customer manually.
Create an NPS Question in Porsline
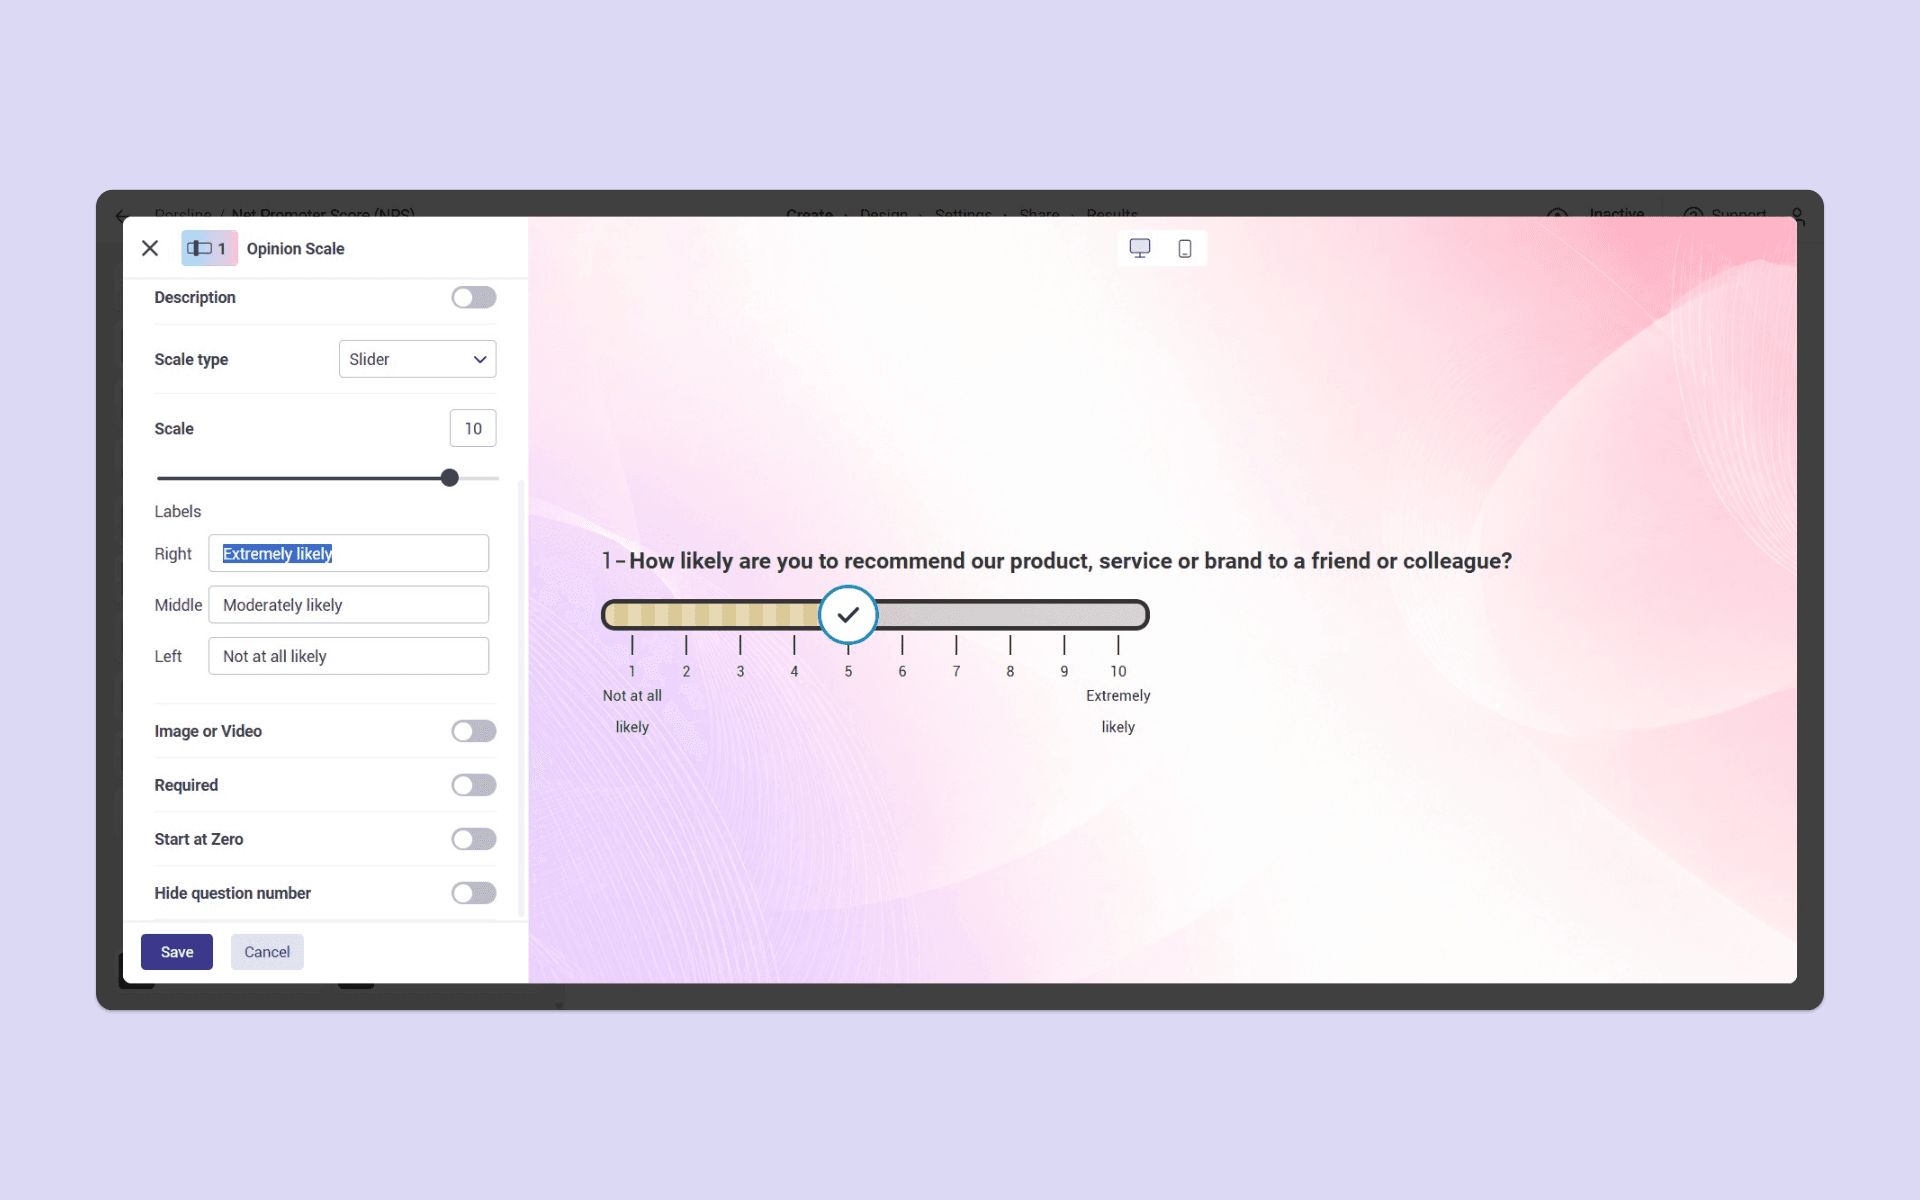
Start by creating a new survey in Porsline and adding an “Opinion Scale” question.
Enter your recommendation question, configure the scale to include scores from 0 to 10, and add suitable labels to explain both ends of the scale. Then save the question.
Alternatively, you can start with Porsline's ready-made NPS Survey template and customise it for your brand.
Once you've created and saved the question, the next step is to set up the text variable used to categorise respondents.
Create a Text Variable for Respondent Categories
In the “Create” phase of your survey, open “Calculated Variables”.
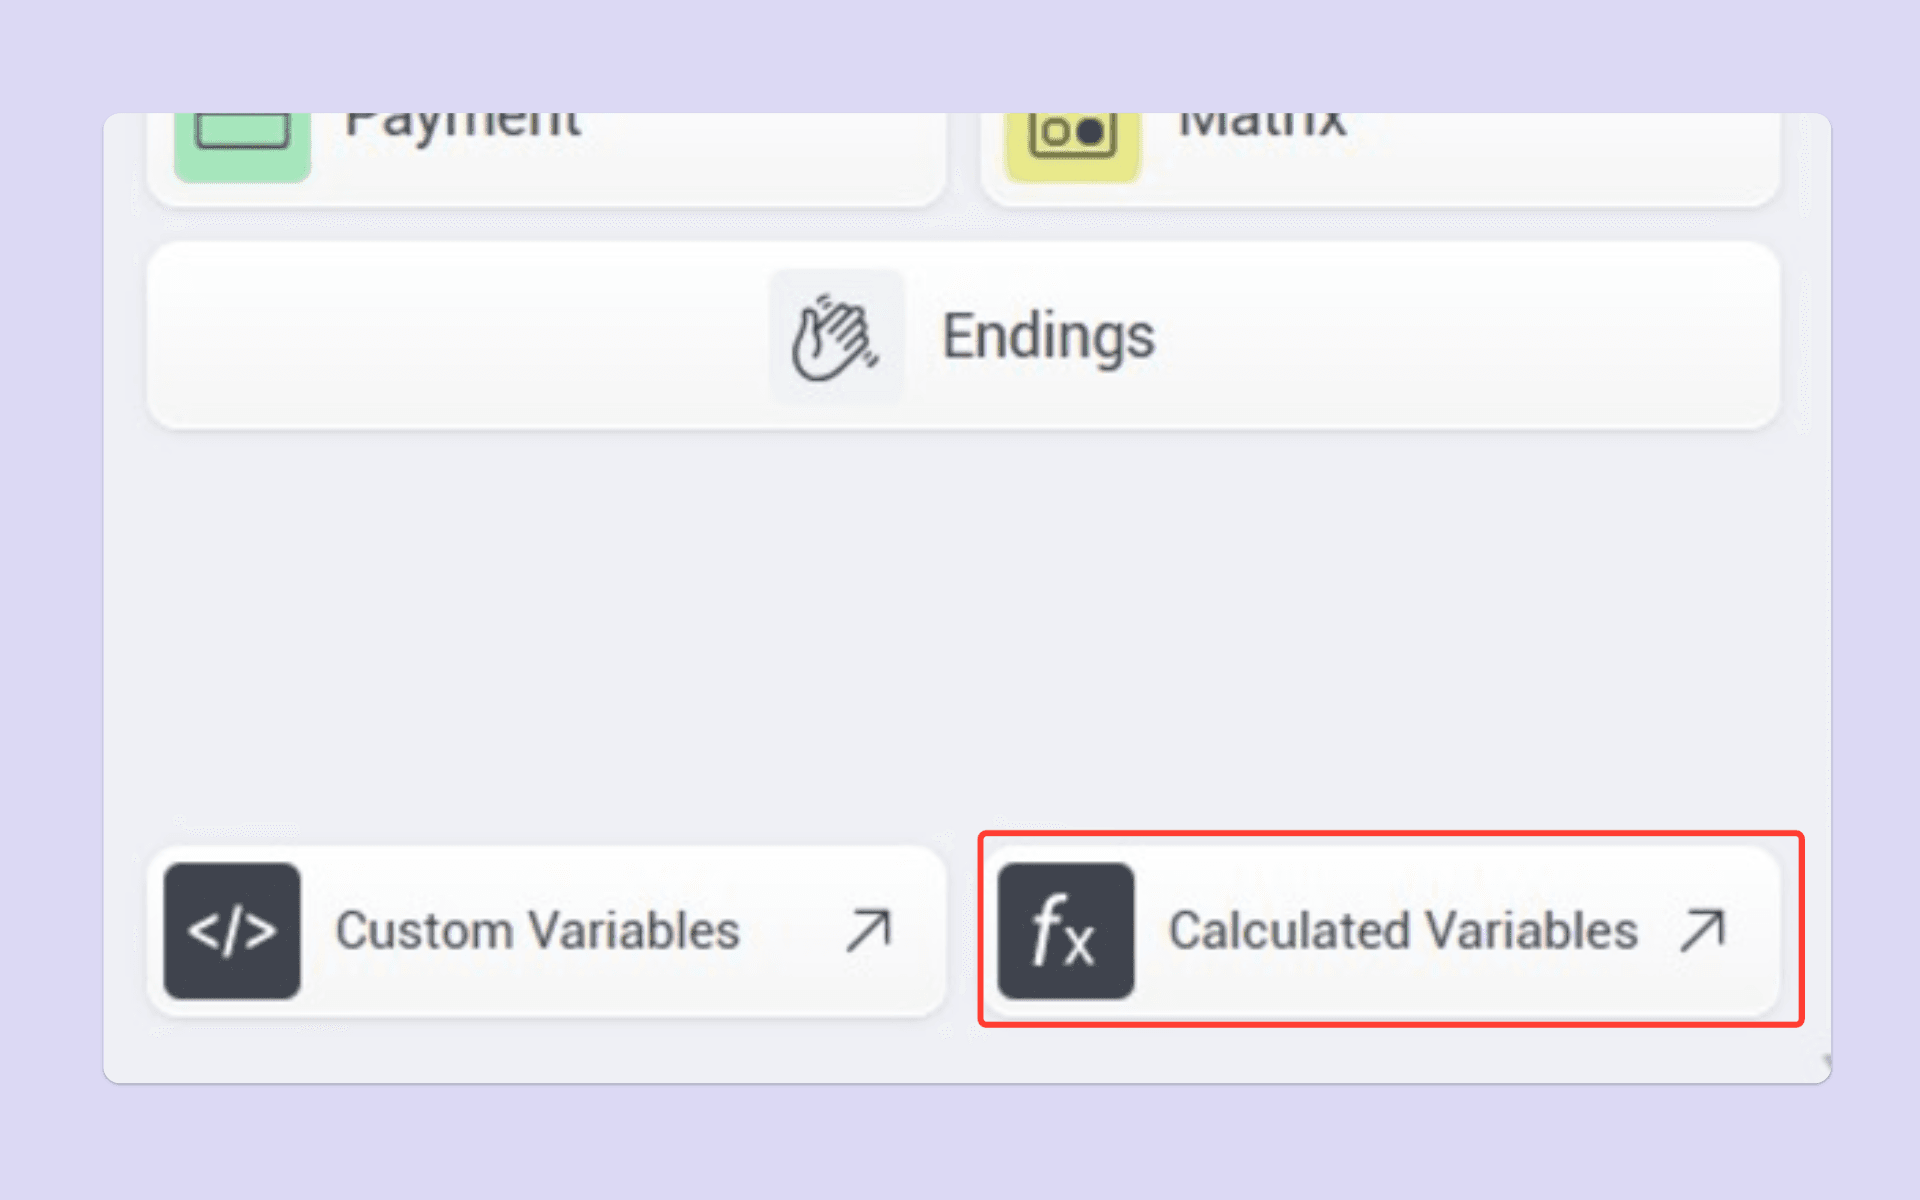
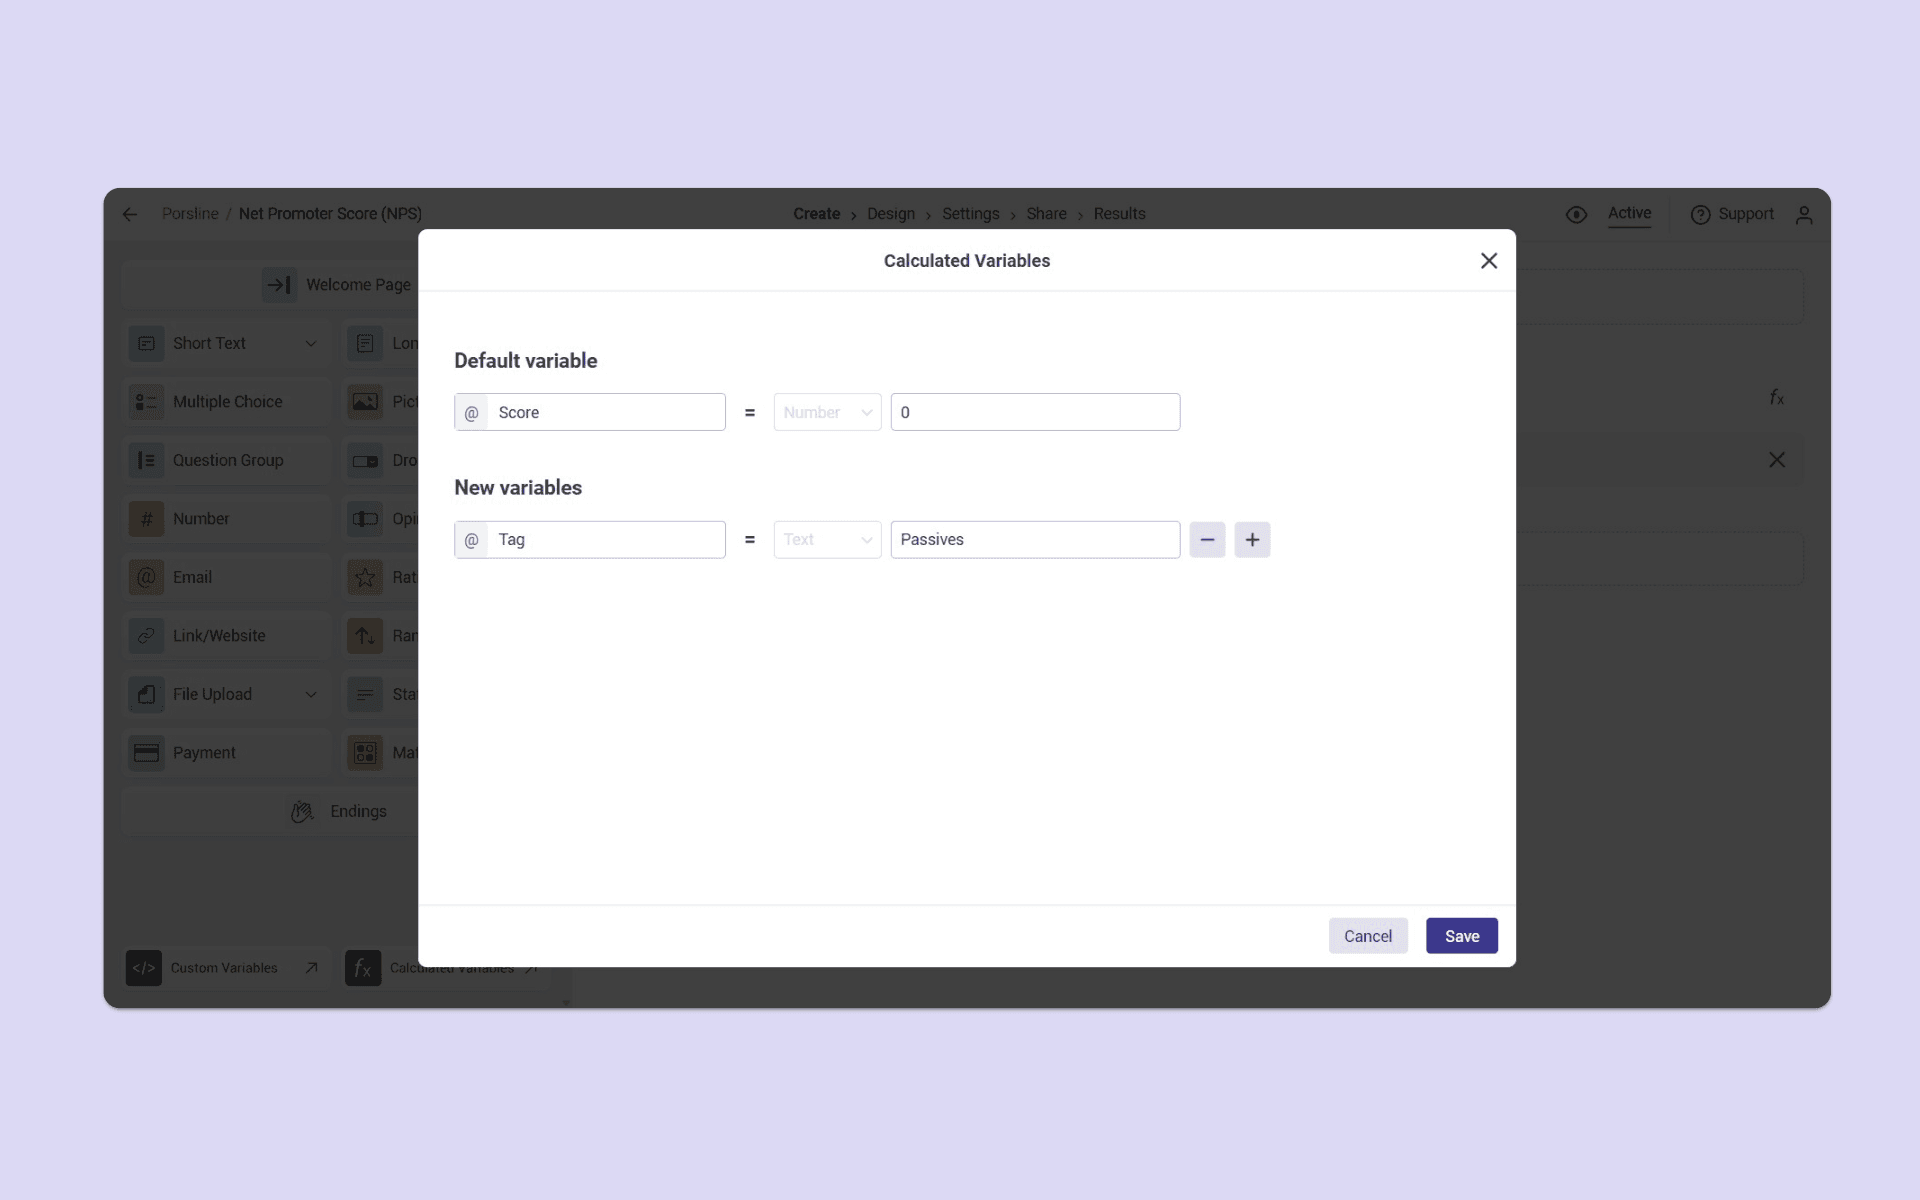
Create a new variable and give it a descriptive name, such as “Customer Category”. Change the variable type to “Text”.
You can assign a default value or leave the field empty so that the value is determined by the respondent's answer.
In our NPS example, we'll use “Passive” as the default value. Customers who select 7 or 8 will retain this label, while calculation rules will assign different labels to respondents in the other two categories.
Save the variable to continue.
Assign Text Labels Using Calculations
After creating the variable, return to the Opinion Scale question.
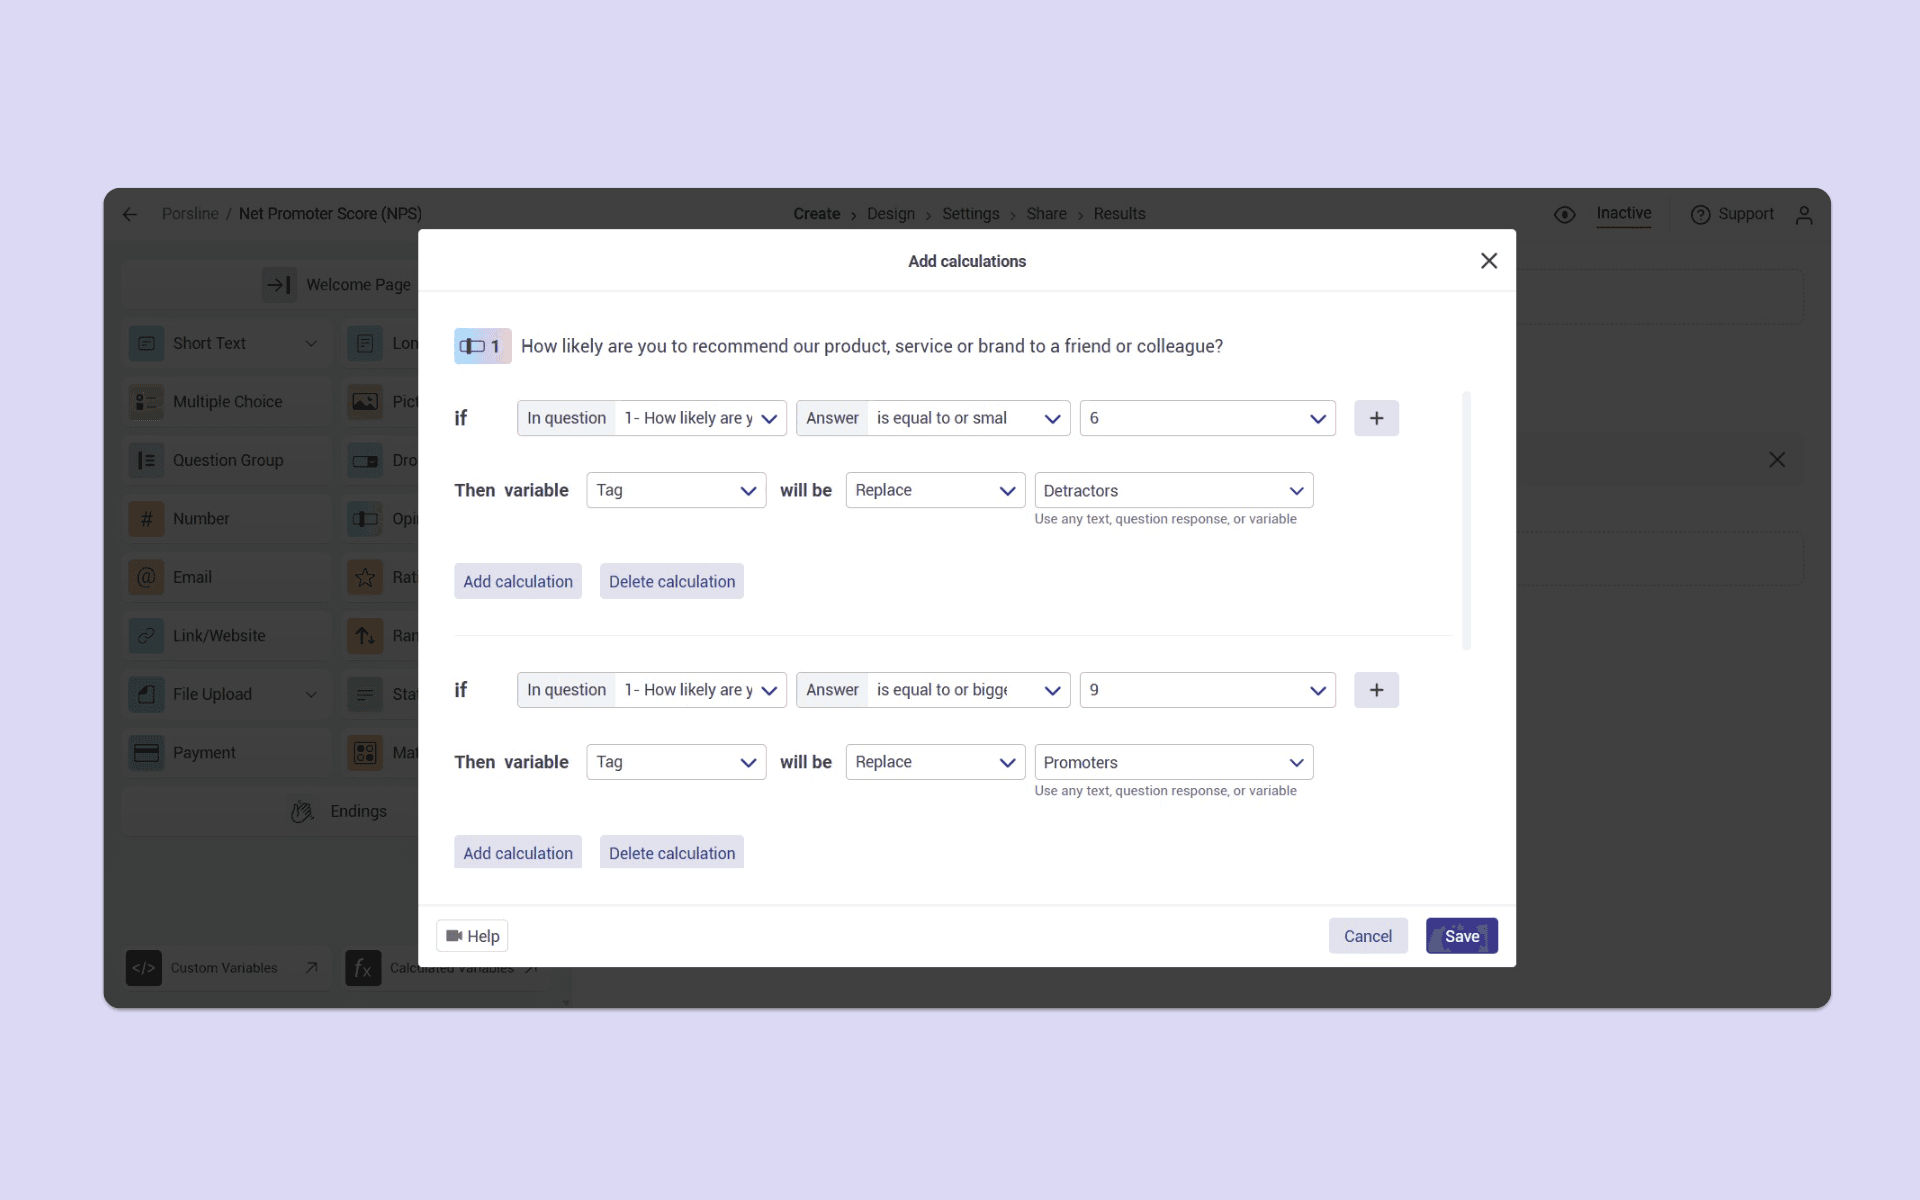
Hover over the question and select “Calculations”. Here, you can define conditions based on the selected NPS score and assign a text value to your new variable.
If you're unfamiliar with the calculation settings, see How to Add Calculations and Scores to Online Forms in Porsline.
1. Categorise Detractors
Set a condition for the NPS question where the selected score is less than or equal to 6.
In the calculation settings, change the target from the default score variable to your “Customer Category” text variable.
Then enter the text value:
“Detractor”
Customers who select a score from 0 to 6 will now receive the Detractor label.
This category can help your team identify customers who may need follow-up and investigate the reasons behind their experience.
2. Categorise Promoters
Add another calculation rule to the same question.
This time, set the condition so that the selected score is greater than or equal to 9.
Select “Customer Category” as the target variable and enter:
“Promoter”
Respondents who select 9 or 10 will be categorised as Promoters.
3. Categorise Passives
If you assigned “Passive” as the default value when creating the text variable, you don't need another calculation rule for this group.
Scores of 7 and 8 do not meet the conditions for Detractors or Promoters, so the variable retains its default value.
However, if you left the default value empty, add a separate rule for scores of 7 or 8 and assign the text value “Passive”.
After setting up the rules, test a response from each category to make sure the correct label is assigned.
View Customer Categories in the Results Table
Once you start collecting responses, go to the “Results” phase in Porsline and open the “Responses”.
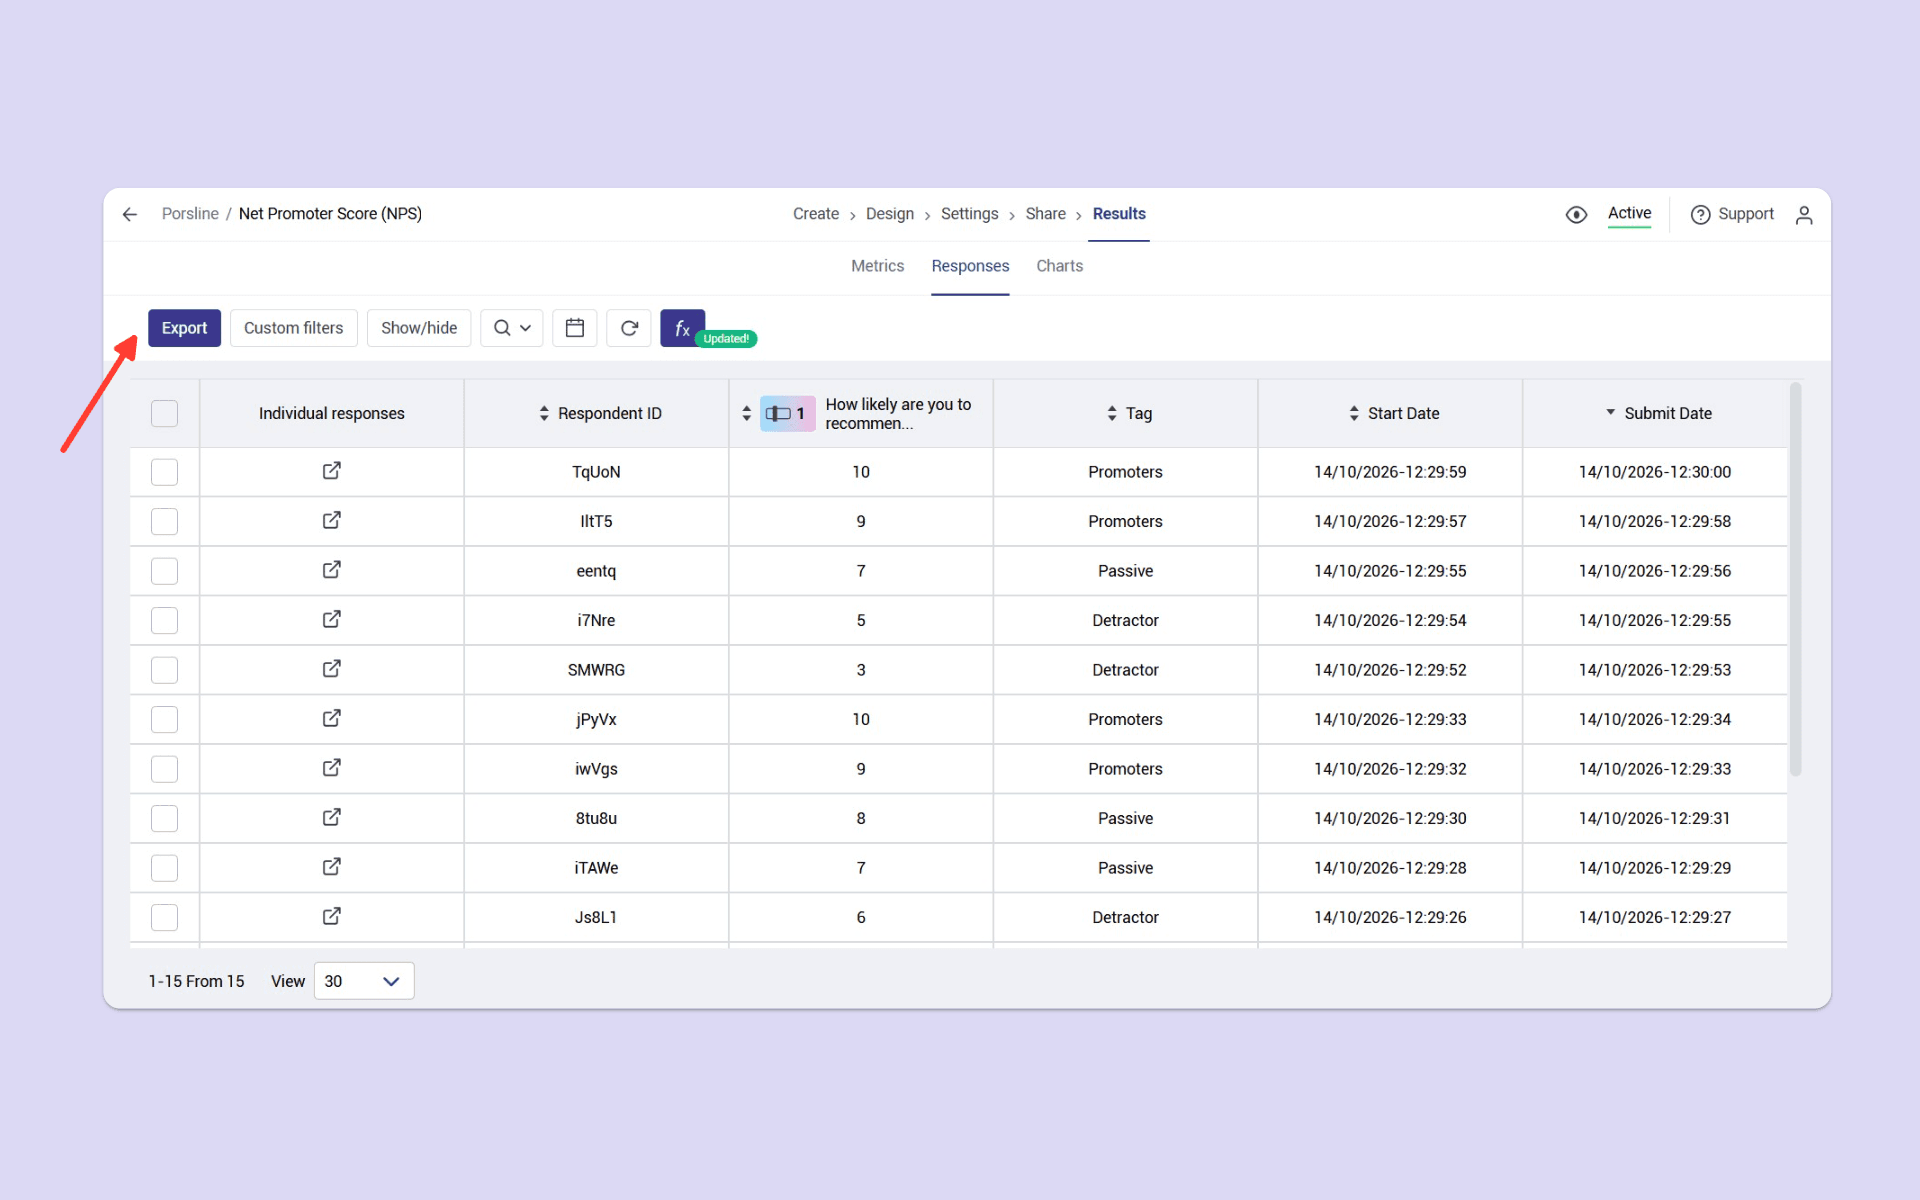
You'll see each respondent's assigned text label alongside their survey answers, based on the calculation rules you've configured.
You can review responses from Detractors, Passives and Promoters separately, or use “Export” to download the survey results as an Excel file.
If you want respondents to see their category after submitting the survey, you can display the text variable on the End Page using the settings available in your account.
For more information, see How to Customize the End Page in Porsline.
Analyse NPS Results and Calculate the Net Promoter Score
In “Charts ”, you can review the distribution of customers across the categories defined by your text variable.
You can then calculate your Net Promoter Score using the following formula:
NPS = Percentage of Promoters − Percentage of Detractors
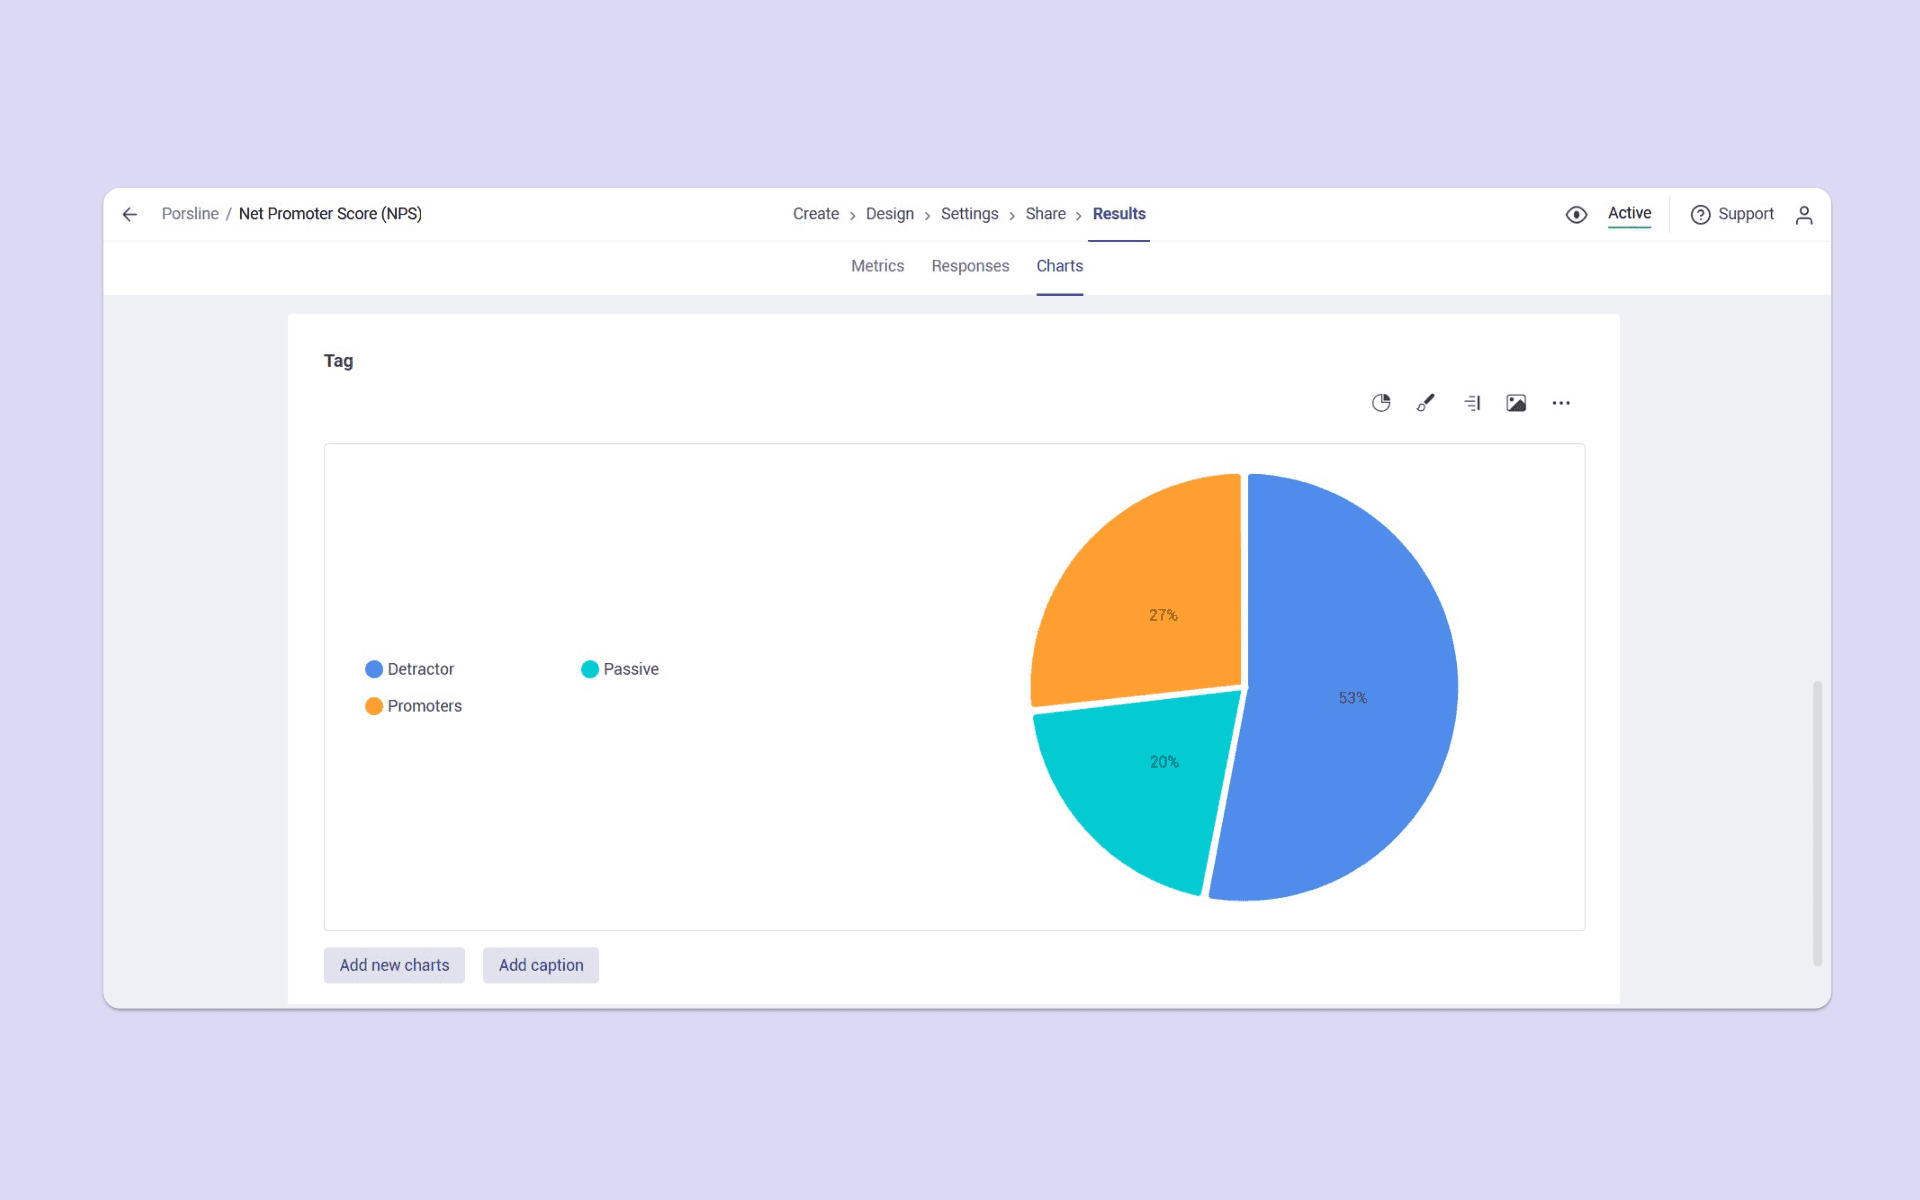
To calculate each percentage, divide the number of customers in that category by the total number of valid responses to the NPS question, then multiply by 100.
For example, if 60% of respondents are Promoters and 20% are Detractors, your NPS is +40 points.
Passives are not directly subtracted in the formula, but they are included in the total number of responses used to calculate the percentages.
By using Text Variables, you can review the distribution of customers by category without manually sorting every response.
Filter Survey Results by Text Label
You can also use Multilevel Filters in the Results phase to analyse specific groups of respondents.
For example, to view only customers classified as Detractors:
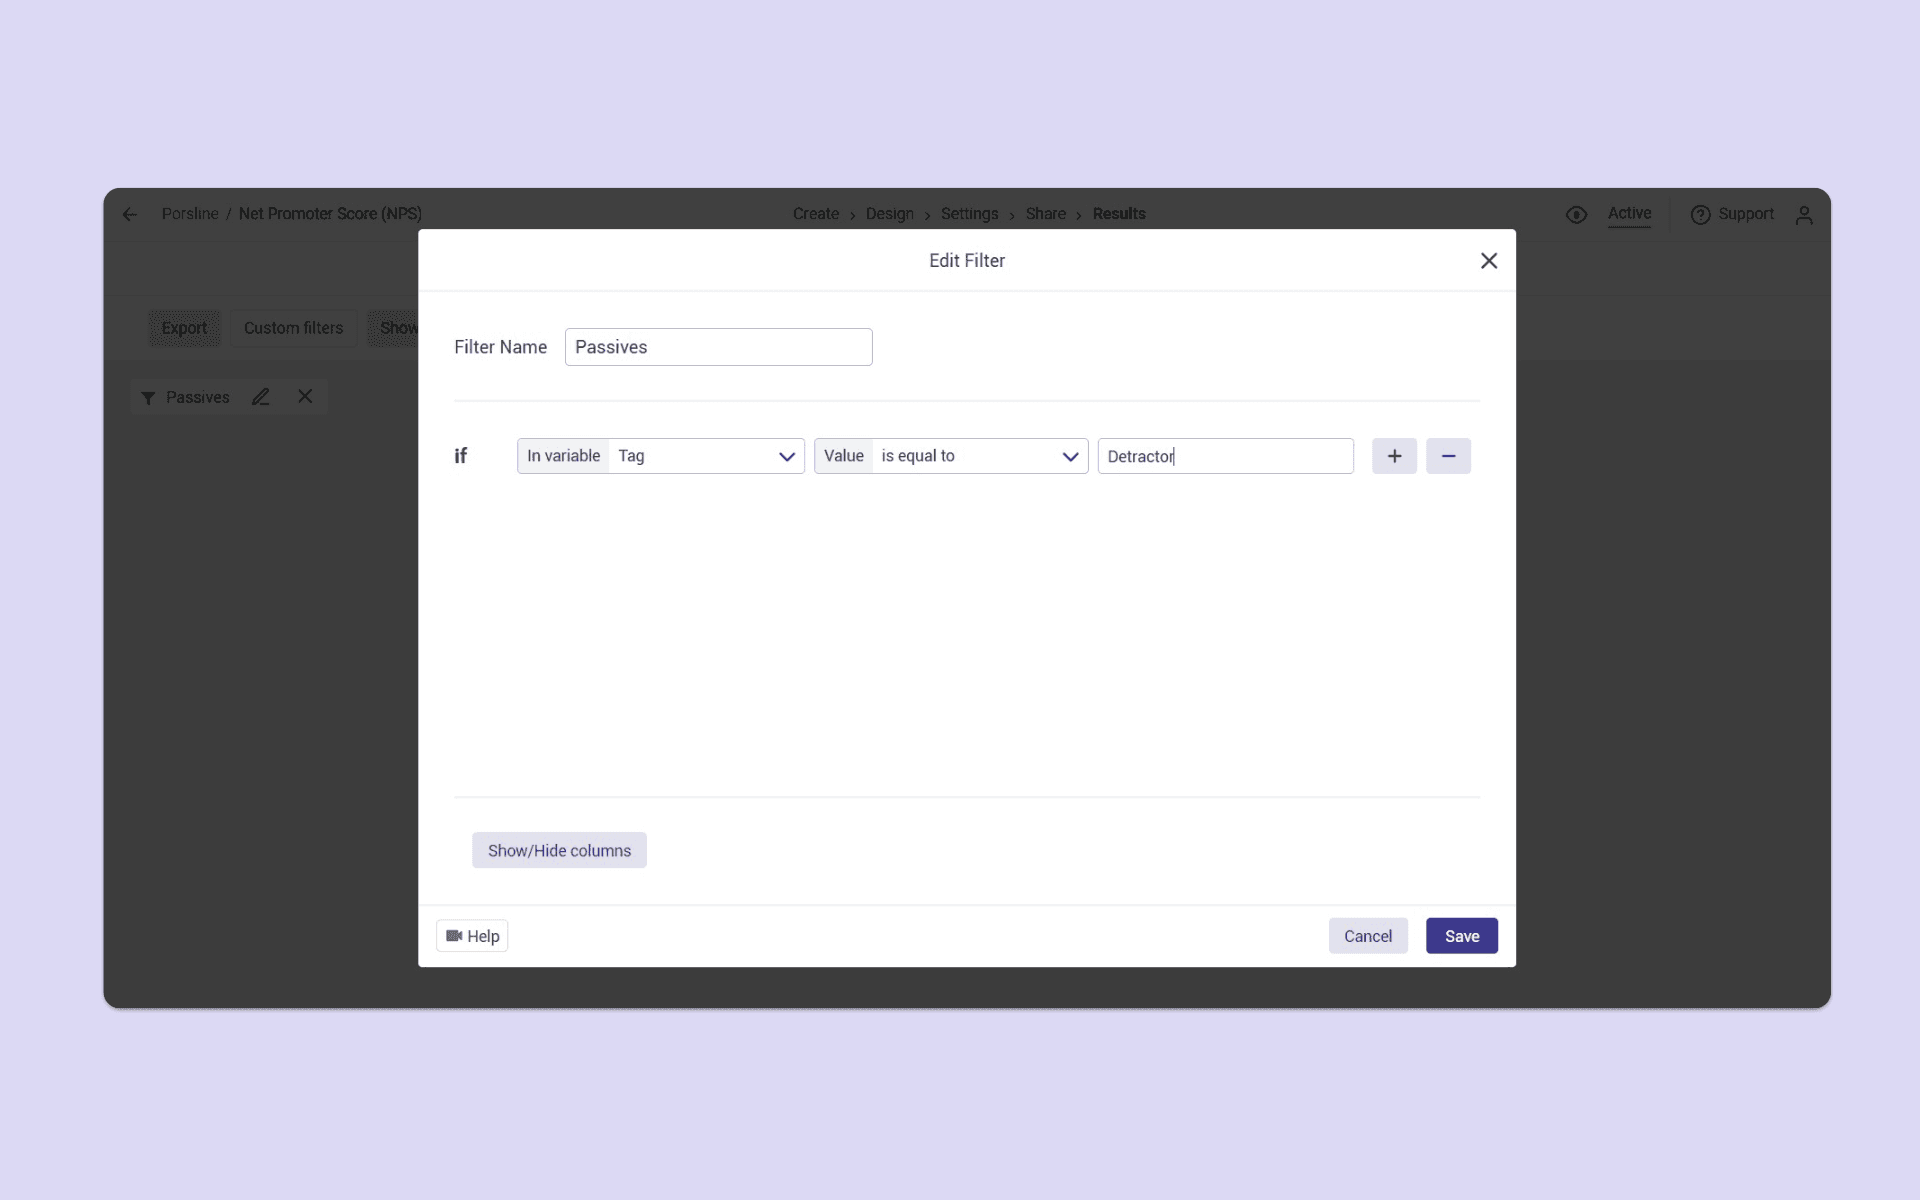
- Go to “Responses”.
- Open the Multilevel Filters controls.
- Select the “Custom filters” text variable.
- Set the condition to equal “Detractor”.
- Apply the filter to review responses from this group.
Once the filter is applied, you can review the corresponding results and charts and export the data needed for your analysis.
You can repeat the process for Passives or Promoters, or combine multiple conditions for more focused reporting.
Add Notes to Charts and Share Reports
After analysing your survey results, you can use the available advanced reporting options to add notes to charts, create additional visualisations and share reports with your team, depending on your account's available features.
This makes it easier to organise NPS findings and discuss them with teams responsible for customer experience and service improvements.
If you have questions about using Text Variables or categorising respondents in Porsline surveys and forms, contact the Porsline support team for assistance.