



Likert scales help researchers and organisations measure the strength of an opinion rather than reducing it to a simple “yes” or “no”. They are widely used to assess satisfaction, agreement, frequency, perceived quality and likelihood across customer, employee, education and research surveys.
A well-designed Likert-scale question gives respondents clear, graduated options while producing structured data that can be compared and analysed. However, the quality of the results depends on choosing the right number of points, writing balanced labels and matching the scale to the concept being measured.
This guide explains how Likert scales work, compares 3-, 4-, 5- and 7-point formats, provides practical examples and shows how to design and analyse Likert-scale questions in an online survey.
What Is a Likert Scale?
A Likert scale is a survey method used to measure attitudes, perceptions and behaviours through ordered response options. Instead of asking respondents to choose between two answers, it allows them to indicate the degree to which they agree, feel satisfied or experience a particular behaviour.
For example, a customer could respond to the statement:
“I am satisfied with the delivery experience.”
Using the following response options:
Very dissatisfied, Dissatisfied, Neither satisfied nor dissatisfied, Satisfied, Very satisfied.
The method was introduced by Rensis Likert in his research on the measurement of attitudes.
Strictly speaking, an individual statement is a Likert item. A complete Likert scale usually combines several related items whose scores are used to measure a broader concept, such as customer satisfaction, employee engagement or perceived service quality.
Likert scales are commonly used in market research, customer experience, human resources, education, psychology and academic research because they convert subjective opinions into ordered, analysable responses.
What Are the Types of Likert-Scale Questions?
The response scale should reflect the specific concept you want to measure. Common Likert-type questions include:
| Type of Likert-scale question | What does it measure? | Example question or statement |
|---|---|---|
| Agreement question | The degree of agreement or disagreement with a statement | I believe our flexible-working policy is suitable for our team. |
| Satisfaction question | The level of satisfaction with a service or experience | How satisfied are you with the support team’s response time? |
| Frequency question | How often a behaviour or activity occurs | How often do you use the reporting dashboard each week? |
| Quality question | The perceived quality of a product or service | How would you rate the quality of the course content? |
| Likelihood question | The likelihood of taking a future action | How likely are you to recommend the service to a colleague? |
| Intensity question | The strength of a feeling or perception | I feel that my daily responsibilities are clearly defined. |
Identify what you want to measure before selecting the labels. Do not use agreement options for a frequency question or satisfaction options for a question about importance.
For guidance on selecting other formats, see Porsline’s guide to choosing survey question types.
Types of Likert Scales: 3-, 4-, 5- and 7-Point Scales
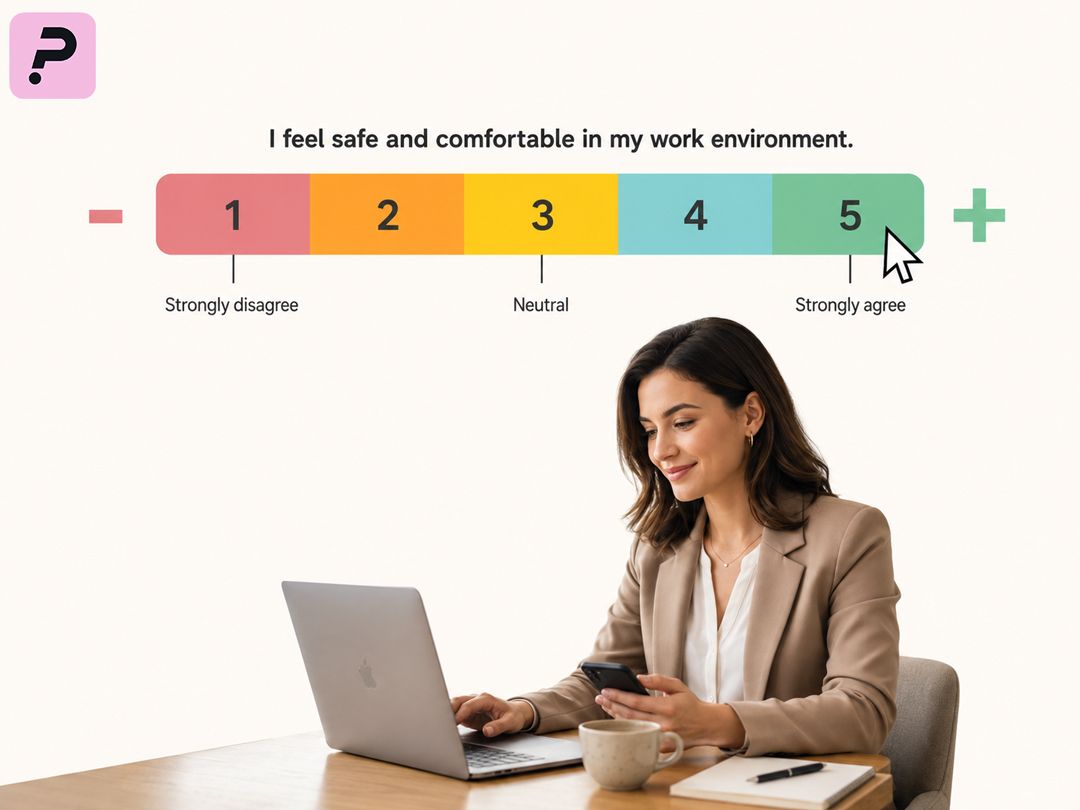
Likert scales vary according to the number of response options presented to respondents. The appropriate number depends on the level of detail you need. Are you looking for a quick overall impression, or do you need to identify subtle differences between levels of satisfaction, agreement or frequency?
Five- and seven-point Likert scales are commonly used because they provide sufficient gradation without overwhelming respondents with too many options. An article published in the Journal of Graduate Medical Education on analysing Likert-scale data also notes that Likert scales typically contain five or seven ordered response options.
3-Point Likert Scale
A 3-point Likert scale is the simplest format. It is useful when you need to measure a general attitude or obtain a quick impression without requiring a detailed range of responses.
Example:
| Statement | Response options |
|---|---|
| The current working policy is suitable for our team. | Disagree, Neither agree nor disagree, Agree |
This format is suitable for short surveys or situations where the analysis does not require fine distinctions. Its main limitation is that it may not capture small differences between respondents. Someone who agrees only slightly and someone who agrees strongly may both select the same option.
4-Point Likert Scale
A 4-point Likert scale provides four response options and usually excludes a neutral midpoint. It is therefore used when you want respondents to indicate a clear direction rather than remain in the middle.
Example:
| Statement | Response options |
|---|---|
| The purchasing process was easy. | Strongly disagree, Disagree, Agree, Strongly agree |
This format can be useful when neutrality is not appropriate for the decision being evaluated. However, it should be used carefully because removing the neutral option may pressure some respondents into selecting an answer that does not accurately represent their position.
5-Point Likert Scale
The 5-point Likert scale is one of the most widely used formats in satisfaction and agreement surveys. It balances ease of response with a clear progression between the available options and usually includes a neutral midpoint.
Example:
| Statement | Response options |
|---|---|
| I am satisfied with the quality of customer service. | Strongly disagree, Disagree, Neither agree nor disagree, Agree, Strongly agree |
This format is frequently used in customer satisfaction surveys, employee surveys, training evaluations and internal opinion surveys. It gives respondents sufficient room to express their views without making the question unnecessarily complex.
7-Point Likert Scale
A 7-point Likert scale offers seven response levels and is used when you need to identify finer differences between levels of satisfaction, agreement or frequency. It is therefore more common in academic research, psychological studies and surveys that require more detailed analysis.
Example:
| Statement | Response options |
|---|---|
| I feel that the working environment helps me concentrate. | Strongly disagree, Disagree, Somewhat disagree, Neither agree nor disagree, Somewhat agree, Agree, Strongly agree |
Although a 7-point scale allows respondents to express more nuanced differences, it is not suitable for every situation. When surveying a general audience or using a long questionnaire, a 5-point Likert scale may be clearer and easier to complete.
| Scale type | Number of options | When should it be used? | Point to consider |
|---|---|---|---|
| 3-point Likert scale | 3 | For quick impressions and short surveys | It may be too limited to measure subtle differences |
| 4-point Likert scale | 4 | When you do not want to offer a neutral option | It may push some respondents towards a position that does not accurately represent them |
| 5-point Likert scale | 5 | For satisfaction, agreement, customer-experience and employee-experience surveys | The response options must be worded and balanced carefully |
| 7-point Likert scale | 7 | For research or situations that require finer gradation | It may take longer to process or feel more complex to some respondents |
How Many Response Options Should a Likert Scale Have?
There is no single number of response options that is suitable for every survey using a Likert scale. The right choice depends on the purpose of the question, the target audience, the length of the survey and the level of detail required for analysis. However, five- and seven-point Likert scales are frequently used, particularly when measuring agreement, satisfaction or frequency.
A 3-point Likert scale may be sufficient when the objective is to collect a quick overall impression. A 5-point Likert scale is often a practical choice when you need to balance ease of response with analytical detail. A 7-point Likert scale may be more appropriate when you need to identify finer differences between levels of opinion or feeling.
| Number of options | When is it appropriate? | Example response options | Point to consider |
|---|---|---|---|
| 3 options | When measuring a quick impression or general attitude | Disagree, Neither agree nor disagree, Agree | Simple, but it does not reveal subtle differences |
| 4 options | When you do not want to provide a neutral option | Strongly disagree, Disagree, Agree, Strongly agree | It may push respondents towards a position that does not fully represent their view |
| 5 options | For most satisfaction, agreement, customer-experience and employee-experience surveys | Strongly disagree, Disagree, Neither agree nor disagree, Agree, Strongly agree | The two sides of the scale must be clearly balanced |
| 7 options | For research or studies that require finer gradation | From strongly disagree to strongly agree, with intermediate response levels | It may feel longer or more complex to some respondents |
Do not choose the number of options simply because a particular format is popular. Base the decision on how you intend to use the results. A 3- or 5-point scale may be sufficient when you need a quick indication of an overall trend. For academic research or a detailed study, a 7-point scale may provide more room to understand differences between participants.
The Difference Between Bipolar and Unipolar Likert Scales
When designing a Likert-scale question, choosing the number of response options is not enough. You must also decide on the direction of the scale. Do you want to measure an attitude between two opposing positions, or the degree to which a particular behaviour, feeling or experience is present?
This is the fundamental difference between a bipolar Likert scale and a unipolar Likert scale.
Bipolar Likert Scale
A bipolar Likert scale is used when the response falls between two opposing positions, such as agreement and disagreement, satisfaction and dissatisfaction, ease and difficulty, or acceptance and rejection.
Example:
| Statement | Response options |
|---|---|
| I am satisfied with my experience of using the service. | Very dissatisfied, Dissatisfied, Neither satisfied nor dissatisfied, Satisfied, Very satisfied |
In this example, respondents move between two clearly opposing ends: dissatisfaction and satisfaction. This type of scale is therefore appropriate for measuring attitudes and opinions, such as customer satisfaction, employee satisfaction, perceptions of internal policies, or levels of agreement with a particular decision.
Unipolar Likert Scale
A unipolar Likert scale is used when you want to measure the degree to which one attribute is present, without a directly opposing attribute at the other end. This may involve the frequency of a behaviour, perceived quality, level of importance, or likelihood of taking a particular action.
Example:
| Question | Response options |
|---|---|
| How often do you use the reporting dashboard? | Never, Rarely, Sometimes, Often, Always |
In this example, the question does not measure a position between “agree” and “disagree”. Instead, it measures the frequency of a single behaviour. A unipolar scale is therefore suitable for questions about frequency, quality, likelihood, importance or intensity.
| Point of comparison | Bipolar Likert scale | Unipolar Likert scale |
|---|---|---|
| What does it measure? | An attitude between two opposing positions | The degree to which one attribute is present |
| Example uses | Satisfaction, agreement, ease and acceptance | Frequency, quality, importance and likelihood |
| Example response options | Strongly disagree ← Strongly agree | Never ← Always |
| Midpoint | Usually includes a neutral midpoint | May include a middle option, but it does not necessarily represent neutrality |
| When is it appropriate? | When measuring an opinion or attitude towards a statement | When measuring intensity, frequency or likelihood |
Choosing the correct direction makes the question clearer for respondents and the results easier to interpret. When asking about the degree of agreement, use a bipolar scale. When asking how often a behaviour occurs, the level of quality, or the likelihood of recommending something, a unipolar scale will generally be more appropriate.
In one sentence: A bipolar scale measures a position between two opposing ends, such as dissatisfied and satisfied, while a unipolar scale measures how much of one attribute is present, such as frequency, importance or likelihood.
Applications of Likert-Scale Questions in Surveys
One of the main strengths of the Likert scale is its flexibility and ability to support different types of survey questions. It is not limited to measuring agreement and disagreement; it can also measure satisfaction, frequency, quality, intensity, likelihood and general perceptions.
For this reason, Likert scales appear in human resources surveys, customer-experience surveys, market research, education, training, psychological studies and academic research. The important point is to choose a question type and response options that accurately match what you intend to measure.
Frequency and Everyday Behaviour Questions
- Purpose: Measure how often a particular behaviour or habit occurs.
- Example: I organise my desk before leaving work.
- Response options: Never, Rarely, Sometimes, Often, Always.
- Where they are used: Human resources surveys, behavioural studies and organisational analysis.
Quality-Assessment Questions
- Purpose: Understand the perceived quality of an experience, product or service.
- Example: How would you rate the quality of the product in relation to its price?
- Response options: Very poor, Poor, Acceptable, Good, Excellent.
- Where they are used: Customer experience, product evaluations and e-commerce.
Intensity Questions
- Purpose: Measure the strength of a feeling or personal perception.
- Example: I feel that I have the skills required to perform my job effectively.
- Response options: Strongly disagree, Disagree, Neither agree nor disagree, Agree, Strongly agree.
- Where they are used: Professional development, skills assessment and psychology surveys.
Agreement and Disagreement Questions
- Purpose: Measure the degree of agreement or disagreement with an idea or decision.
- Example: I believe that weekly meetings are useful for my team.
- Response options: Strongly disagree, Disagree, Neither agree nor disagree, Agree, Strongly agree.
- Where they are used: Employee surveys, internal opinion surveys and policy evaluations.
General Satisfaction Questions
- Purpose: Measure the level of satisfaction with a service or experience.
- Example: How satisfied are you with the speed of order delivery?
- Response options: Very dissatisfied, Dissatisfied, Neither satisfied nor dissatisfied, Satisfied, Very satisfied.
- Where they are used: Customer service, after-sales evaluations, course evaluations and event feedback.
Likelihood and Recommendation Questions
- Purpose: Measure the likelihood of a future action, such as recommending a business or making another purchase.
- Example: How likely are you to recommend our shop to a friend?
- Response options: Very unlikely, Unlikely, Neither likely nor unlikely, Likely, Very likely.
- Where they are used: Marketing, customer loyalty, customer experience and sales.
With Porsline, you can use several of these question formats within the same survey, depending on your objective. For example, a customer satisfaction survey may include a question measuring overall satisfaction, another assessing service quality and a third measuring likelihood to recommend. An employee satisfaction survey may include questions about agreement with workplace policies, feelings of recognition, clarity of responsibilities and sense of belonging.
For a practical example that you can customise, start with Porsline’s customer satisfaction survey template or employee satisfaction survey template, then adapt the Likert-scale statements and response options to match your survey objective.
How to Design Likert-Scale Questions Without Introducing Bias
Designing Likert-scale questions may appear straightforward: you write a statement and add graduated response options ranging from “strongly disagree” to “strongly agree”. However, the quality of the results depends on more than the number of options. It is also influenced by the wording of the question, the clarity of the labels and the order in which the answers appear.
A biased question may lead respondents towards a particular answer without them noticing, make some options appear more attractive than others, or allow participants to interpret the wording differently. The clearer and more neutral the question is, the more closely the results will reflect respondents’ genuine views. You can also consult Porsline’s guide to survey bias to understand common types of bias and how to reduce them.
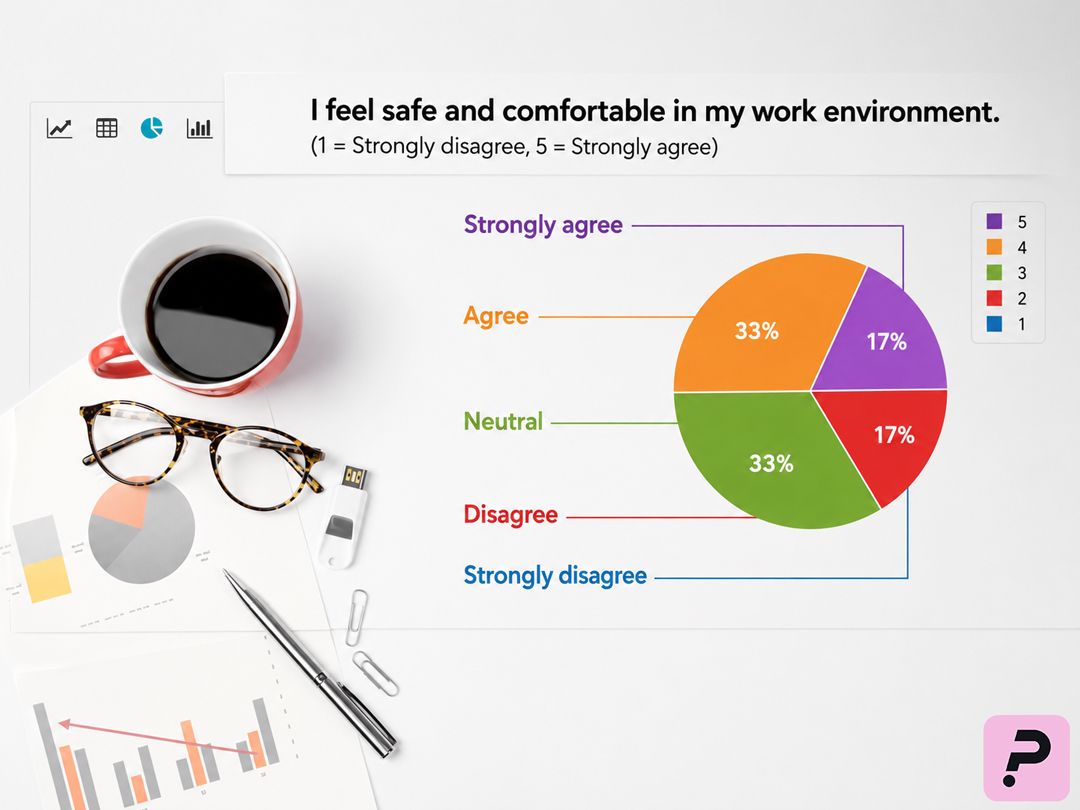
Write Likert-Scale Questions Clearly
Always begin with a clear, specific statement, and avoid wording that assumes a particular answer. For example, instead of asking:
“How satisfied are you with our services?”
It may be better to ask:
“How satisfied or dissatisfied are you with our services?”
The first question focuses only on satisfaction, whereas the second explicitly allows respondents to express either satisfaction or dissatisfaction. In many cases, it is even better to make the statement more specific, such as:
“I am satisfied with the support team’s response time.”
You can then provide the following response options:
Strongly disagree, Disagree, Neither agree nor disagree, Agree, Strongly agree.
The more specific the question is, the easier its answers will be to analyse. A broad question such as “Are you satisfied with our services?” may combine several factors in a single question, including price, response time, product quality, ease of use and the purchasing experience. A specific question helps you identify the precise source of a strength or problem.
Pay Attention to Likert Scale Labels
Response labels directly affect how respondents understand the scale. Providing numbers from 1 to 5 without explaining what they mean is therefore not enough, particularly when the survey is intended for a diverse audience or for customers and employees rather than researchers alone.
Make sure the response options are:
- Clear and easy to understand.
- Balanced between both ends of the scale.
- Distinct rather than overlapping in meaning.
- Appropriate for the type of question.
- Written in language that the survey audience understands.
For example, when one end of the scale is “very satisfied”, the opposite end should be equally clear, such as “very dissatisfied”. When including a middle option, define it precisely. Does it mean “neither agree nor disagree”, “don’t know” or “not applicable”? Each of these responses has a different meaning.
| Use case | Appropriate middle option | When should it be used? |
|---|---|---|
| Measuring agreement | Neither agree nor disagree | When the respondent has a genuinely intermediate or non-directional position |
| Measuring knowledge | Don’t know | When the respondent does not have enough information to answer |
| Measuring experience or applicability | Not applicable | When the situation does not apply to the respondent |
Using the middle option inaccurately can weaken the analysis. A respondent who does not know the answer is different from one who has a neutral position. Similarly, someone who has never used a service is different from someone who has used it but does not hold a strong opinion.
The Order of Likert Scale Options Matters
The order of the response options may affect how respondents read the question, particularly in long surveys or when the options are viewed quickly on a mobile screen. It is therefore advisable to maintain a logical and consistent order throughout the survey.
When you begin the scale with the negative option and progress towards the positive option, for example:
Strongly disagree ← Disagree ← Neither agree nor disagree ← Agree ← Strongly agree
Keep this direction consistent across all similar questions. Do not reverse the order from one question to another unless there is a clear reason to do so, as changing direction may confuse respondents and increase the likelihood of unintended answers.
Likert scale options should also be balanced. When you provide two positive options, include two corresponding negative options and one clearly defined midpoint. For example:
| Unbalanced wording | Better wording |
|---|---|
| Poor, Good, Very good, Excellent, Outstanding | Very poor, Poor, Acceptable, Good, Very good |
| Dissatisfied, Neutral, Satisfied, Very satisfied, Delighted | Very dissatisfied, Dissatisfied, Neither satisfied nor dissatisfied, Satisfied, Very satisfied |
Review Each Question Before Publishing the Survey
Before sending the survey, read every question from the respondent’s perspective. Is the statement understandable on the first reading? Do the response options cover all reasonable possibilities? Is there an appropriate middle option? Could any word lead the respondent towards a particular answer?
A simple review before publication can save considerable work later when cleaning the data or interpreting unclear results. The purpose of a Likert scale is not simply to collect a large number of responses, but to collect responses that can be compared, analysed and used to support decisions.
Key Steps for Designing Likert-Scale Questions
Use a Likert scale when you need to measure a concept that cannot be reduced to a single question, such as customer satisfaction, employee engagement, the quality of a learning experience, or acceptance of a new policy. These concepts are usually measured through a group of questions covering the factors that influence them.
For example, asking “Are you satisfied with our service?” is not enough when you want to understand customer satisfaction in depth. A customer may be satisfied with the product quality but dissatisfied with delivery speed or after-sales service. It is therefore better to divide the concept into smaller components and write a separate Likert-scale question for each one.
| Concept you want to measure | Factors that can be measured | Example Likert-scale statement |
|---|---|---|
| Customer experience | Product quality, price, delivery speed and support | I am satisfied with the speed at which my order was delivered. |
| Employee experience | Working environment, management, recognition and clarity of responsibilities | I feel that my daily responsibilities are clearly defined. |
| Learning experience | Content quality, instructor performance and course organisation | The course content was clear and useful. |
| User experience | Ease of use, speed of access and clarity of the steps | It was easy to complete the form from beginning to end. |
When building a questionnaire from the beginning, reviewing Porsline’s guide to designing an effective survey can help you refine the questions before finalising them.
Step 1: Define the Objective of Your Likert-Scale Survey
Begin by defining the survey objective precisely. What decision do you want to make after collecting the responses? Do you want to improve the customer experience, measure employee satisfaction, evaluate the effectiveness of a training course, or understand how an audience perceives a new idea or product?
The clearer the objective is, the easier it becomes to write suitable questions. For example, when you want to understand how interested customers are in buying a product online, an appropriate question might be:
“How likely are you to purchase this product online?”
The response options could be:
Very unlikely, Unlikely, Neither likely nor unlikely, Likely, Very likely.
However, when your objective is to measure how frequently a particular behaviour occurs, use a different question format, such as:
“How often do you purchase this type of product online?”
The response options could be:
Never, Rarely, Sometimes, Often, Always.
Step 2: Design the Likert-Scale Questions and Response Options
After defining the objective, write the questions and response options. A well-designed Likert-scale question should be clear, specific and neutral. Its response options should be balanced, easy to understand and distinct in meaning.
Apply one simple rule: each question should measure only one idea. Do not combine several factors in the same question, as this makes the responses less precise and the results more difficult to interpret.
| Less precise wording | Better wording |
|---|---|
| I am satisfied with the product, support and delivery speed. | I am satisfied with the speed at which my order was delivered. |
| How satisfied are you with the quality of your order? | I am satisfied with the quality of the product I received. |
| Was the training course excellent and useful? | The training course content was useful. |
| Do you agree that weekly meetings are necessary? | Weekly meetings help my team coordinate its work. |
| Do you like buying this product online? | How likely are you to purchase this product online? |
Make sure that both ends of the scale are balanced. When you include “very satisfied”, it should be matched by “very dissatisfied”. When you use “strongly agree”, it should be matched by “strongly disagree”. This balance makes the scale clearer and reduces the likelihood of directing respondents towards one side.
Design rule: Each Likert item should measure one clearly defined idea, use neutral wording, provide balanced response labels and keep the option order consistent. Avoid double-barrelled statements, unexplained numerical values and scales that offer more positive choices than negative ones.

Step 3: Test the Questions Before Publishing the Survey
Before sending the survey to the full audience, test the questions internally or with a small sample. The purpose of this test is not limited to identifying language errors. It should also confirm that participants understand the questions and response options in the same way.
Before publishing, ask:
- Is the question clear on the first reading?
- Does the question measure only one idea?
- Are the response options balanced?
- Is there an appropriate midpoint?
- Will the responses be easy to analyse after collection?
This simple review helps improve data quality before response collection begins and reduces the need to interpret ambiguous results later.
Analysing Likert-Scale Survey Results
After collecting responses to your Likert-scale questions, the next step is to turn the graduated answer options into a clear understanding of trends and differences. The value of the scale lies not only in the number of responses collected, but in understanding what those responses mean. Do participants tend to agree? Are there clear differences between groups? Is the issue widespread, or is it associated with a particular segment?
Likert-scale questions produce structured, ordered data that can be compared. When necessary, response options can be coded numerically—for example, assigning 1 to “strongly disagree” and 5 to “strongly agree”. However, you should not consider the mean alone, because the distribution of responses may reveal important details that cannot be seen in a single number.
For a more detailed explanation of these calculations, see Porsline’s guide to calculating percentages and means for Likert scales, which explains how to convert responses into readable indicators.
- Frequencies and percentages: Show the number and proportion of participants who selected each Likert-scale option. For example, 42% of employees selected “agree” for the statement “I feel appreciated at work”. Use them when you need a quick and clear view of the response distribution.
- Mean: Indicates the overall direction of the responses after the Likert options have been converted into numbers. For example, the mean satisfaction score for support response time might be 4.1 out of 5. Use it when comparing questions or tracking changes over time, while also reviewing the response distribution.
- Median: Identifies the middle position in the ordered responses. For example, if the median response is “neither agree nor disagree”, approximately half of the responses fall at or below that point and half fall at or above it. It is useful when the response distribution is uneven or contains extreme values.
- Mode: Identifies the response option selected most frequently. For example, the most commonly selected answer might be “agree”. Use it when you need to determine the most prevalent response.
- Standard deviation: Shows how widely the responses are dispersed around the mean. For example, the average satisfaction score may be high while the standard deviation is also large, indicating considerable variation in participants’ views. Use it to understand how closely respondents agree or how widely their opinions differ.
- Segment comparison: Reveals differences in responses by category, region, team or stage of the customer journey. For example, recently hired employees may be less satisfied than longer-serving employees. Use it to identify specific improvement opportunities rather than relying only on the overall result.
Example of Analysing a Likert-Scale Question
Suppose you included the following statement in an employee satisfaction survey:
“I feel that my daily responsibilities are clearly defined.”
The results were as follows:
| Response option | Percentage |
|---|---|
| Strongly disagree | 6% |
| Disagree | 14% |
| Neither agree nor disagree | 20% |
| Agree | 38% |
| Strongly agree | 22% |
In this case, 60% of participants can be described as tending towards agreement because they selected either “agree” or “strongly agree”. However, the 20% who selected the midpoint and the combined 20% who expressed some level of disagreement indicate that unclear responsibilities are not necessarily a universal problem, but the issue still requires attention—particularly when the negative responses are concentrated within a specific team or branch.
When analysing Likert-scale results, therefore, do not ask only, “What is the mean?” Also consider:
- How are the responses distributed across the options?
- Which response option appears most frequently?
- Does one segment differ from the rest of the participants?
- Have the results improved compared with an earlier survey?
- What practical decision can be made based on these findings?
In Porsline, reports and the Results Table help you review the distribution of responses and examine results across questions and relevant segments. You can also export the data to Excel or CSV when you need to conduct additional analysis or use external statistical software such as SPSS.
Analysing a Likert scale is not simply a matter of converting responses into numbers. It involves understanding the overall direction, identifying meaningful differences and turning the findings into a practical decision, such as improving a service, revising a policy, training a team or redesigning an experience.
Analysing Likert-Scale Data in SPSS
When conducting academic research or a study that requires more detailed statistical analysis, you can analyse Likert-scale results in SPSS after exporting the data from your survey platform in Excel or CSV format. Response options are usually coded numerically—for example: 1 = strongly disagree, 2 = disagree, 3 = neither agree nor disagree, 4 = agree and 5 = strongly agree.
After importing the data into SPSS, you can use frequencies and percentages to examine the distribution of responses, and the median or mode to identify the most representative ordered response. Means and standard deviations may also be used when analysing a set of Likert items as a composite measure or when comparing results between different groups, provided that the analytical approach is appropriate to the research design.
For example, when an employee satisfaction survey contains several statements using a 5-point Likert scale, you may compare responses between departments or analyse the relationship between clarity of responsibilities and overall satisfaction. The results should nevertheless be interpreted carefully because individual Likert items produce ordinal data. A mean alone should therefore not be interpreted without examining how the responses are distributed.
Likert Scale Calculator: Calculate the Mean and Analyse the Results
Use the calculator below to analyse Likert-scale responses quickly. Enter the number of responses for each option, or paste raw values from Excel or Google Sheets, to calculate the mean, median, mode, standard deviation, and response distribution.
The calculator supports 3-, 5-, and 7-point scales for satisfaction, agreement, frequency, quality, and importance. All calculations take place inside your browser, and the data you enter is not sent to an external server.
How should you interpret the calculator results?
The mean indicates the overall direction of the responses, while the distribution shows how many participants selected each point on the scale. Standard deviation helps you understand how closely responses are grouped: a higher value indicates greater variation in participants’ views.
Do not rely on the mean alone when analysing Likert-scale data. A positive mean may still hide a dissatisfied segment. Read the mean, distribution, median, mode, and standard deviation together, then interpret them in relation to the survey question and its objective.
How Porsline Helps You Design and Analyse Likert-Scale Surveys
Once you have defined what you want to measure and selected the appropriate response scale, Porsline helps you manage the full workflow—from creating the questions and collecting responses to analysing and exporting the results.
You can use Likert-scale questions for customer satisfaction, employee experience, course evaluation, market research, academic studies and internal feedback. The statements, labels and number of scale points can be customised to match your survey objective.
Design Likert-Scale Surveys Flexibly
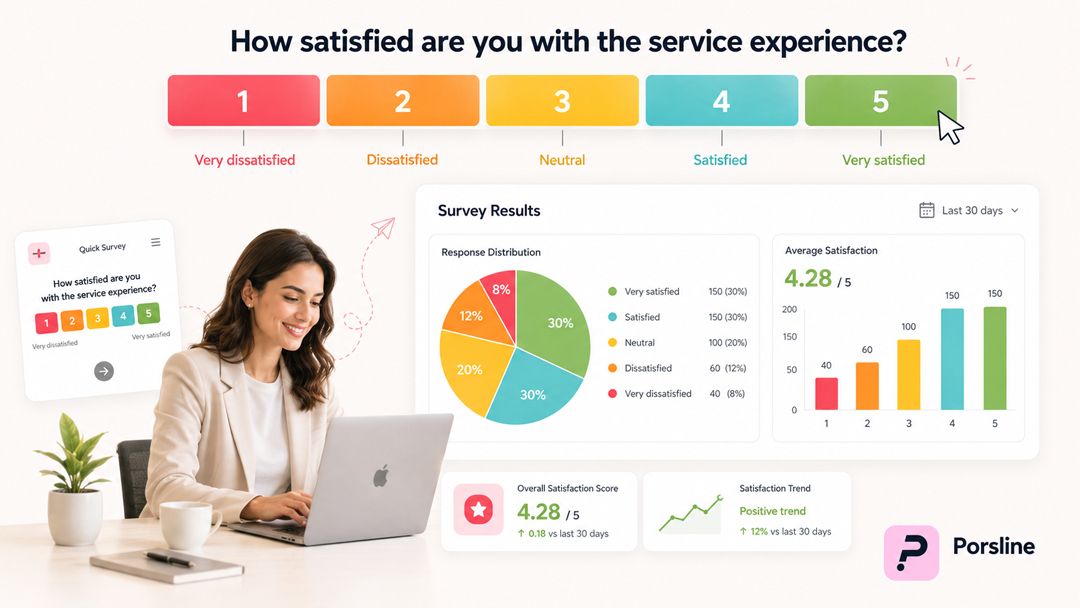
Use the Linear Scale question type to create graduated rating questions. You can then choose how the scale appears to respondents.
Numeric
The scale points appear as separate values, such as 1 to 5 or 1 to 7.
Use Numeric when you want to:
- Display every available scale point clearly.
- Make the options easier to compare.
- Create a 5-point or 7-point scale.
- Reduce the likelihood of respondents selecting an unintended value.
Slider
The scale appears as an interactive bar, and respondents move the slider to select the appropriate value.
Use Slider when you want to:
- Provide a wider range, such as 0 to 10.
- Reduce visual clutter.
- Create a more interactive response experience.
- Measure the intensity of an opinion or rating across a broader range.
Choose Numeric when respondents need to see every available value. Choose Slider when the range is wider and a more compact visual presentation is preferable.
You can also begin with a ready-made survey template and customise the questions, labels and response options instead of building the entire survey from scratch.
Review Likert-Scale Results in Reports
After collecting responses, open the Reports section and use Analysis and Charts to review the results of each Likert-scale question.
A Frequency Table shows:
- The number of responses for each scale point.
- The percentage selecting each option.
- The overall response distribution.
- The mean, median and mode, where applicable.
- The standard deviation and variance.
These indicators should be interpreted together. An average score may suggest a positive overall result, while the response distribution may reveal that a specific group of respondents reported a negative experience.
You can also use the Results Table to review individual submissions, apply filters and examine responses across relevant audience segments.
Export Results for Further Analysis
Porsline allows you to export survey responses in several formats:
| File format | Recommended use |
|---|---|
| Excel (.xlsx) | Reviewing, organising and analysing results in spreadsheets |
| CSV (.csv) | Transferring data to other tools, databases or reporting systems |
| SPSS (.sav) | Continuing statistical analysis directly in SPSS |
The export window also includes an Include filters option. When enabled, the exported file contains only the responses that match the filters currently applied in the Results Table.
The export panel displays the number of responses that will be included before the file is generated. For example:
1 response
This helps you confirm that the selected filters and export scope are correct before downloading the data.
Exporting filtered results is particularly useful when you need to:
- Compare departments, teams or branches.
- Analyse new and long-standing customers separately.
- Review responses from a specific region or audience segment.
- Compare reporting periods.
- Continue the analysis in Excel, SPSS or another external tool.
Connect Survey Data to Other Workflows
Depending on your Porsline plan, you may also connect survey data to tools such as Google Sheets and Zapier. These integrations can help teams share responses, automate follow-up actions and incorporate survey data into existing workflows.
With Porsline: You can create Linear Scale questions, display them using Numeric or Slider formats, analyse response distributions in Reports and the Results Table, apply filters, and export the selected responses as Excel, CSV or SPSS files.
Share Your Survey Easily
After preparing the survey, you can share it through a direct link or QR code, embed it on your website, or distribute it through an email campaign or landing page. The easier the response process is for participants, the greater your opportunity to collect clear, analysable data.
To apply the steps covered in this guide, you can create an online survey in Porsline, add the Likert-scale questions that match your objective and analyse the results from one platform.
How to Create an Online Likert-Scale Survey
Follow these steps to create a practical Likert-scale questionnaire:
- Define the concept or decision you want to measure.
- Divide broad concepts into specific factors.
- Write one clear statement for each factor.
- Select the appropriate scale direction.
- Choose the number of scale points.
- Add clear and balanced response labels.
- Test the questions with a small group.
- Publish and share the survey.
- Review the response distribution and relevant statistics.
- Export the data when further analysis is required.
In Porsline, you can build the survey from scratch or customise a ready-made template.
Create a Likert-scale survey in Porsline.
Conclusion: Using Likert Scales in Surveys
Likert scales provide a practical way to measure the strength of opinions, attitudes and experiences. Their usefulness depends on clear questions, balanced labels, an appropriate number of points and an analysis that considers the full response distribution.
Choose the scale according to the decision you need to make, test the questions before publishing and interpret the findings in context.
You can then use Porsline to create the survey, collect responses and turn the results into practical improvements.
Start creating your survey in Porsline.
FAQ About Likert Scales
What Is a Likert Scale?
A Likert scale is a method for measuring attitudes and opinions through a group of statements with graduated response options, usually ranging from “strongly disagree” to “strongly agree”. An individual question is called a Likert item, while a complete Likert scale consists of several related items whose scores are combined to measure one concept.
What Is a 5-Point Likert Scale?
A 5-point Likert scale contains five response options and usually includes a midpoint. A common example is: Strongly disagree, Disagree, Neither agree nor disagree, Agree and Strongly agree. It is frequently used in customer satisfaction surveys, employee satisfaction surveys, course evaluations and opinion polls.
What Is the Difference Between 3-, 5- and 7-Point Likert Scales?
The main difference is the number of response options and the level of detail they provide. A 3-point Likert scale is suitable for collecting quick overall impressions. A 5-point scale balances ease of response with sufficient analytical detail. A 7-point scale is used when you need finer gradation when measuring an opinion or feeling.
How Many Response Options Should a Likert Scale Have?
There is no single number that is suitable for every situation. When the survey is short and its purpose is to measure a general direction, a 3-point scale may be sufficient. A 5-point scale is a practical choice for most satisfaction and agreement surveys, while a 7-point scale may be appropriate for research or studies requiring more detailed responses.
Is a Likert Scale the Same as a Yes-or-No Question?
No. A yes-or-no question provides only a binary response, whereas a Likert scale provides graduated levels of agreement, satisfaction, frequency or likelihood. A Likert scale is therefore more suitable when you need to understand the strength of an opinion rather than simply whether it exists.
How Do You Analyse Likert-Scale Results?
You can analyse Likert-scale results using frequencies and percentages, as well as the median, mode, mean and standard deviation where appropriate. The important point is not to rely on the mean alone. You should also examine the distribution of responses and differences between relevant segments, such as new and long-standing customers or different workplace teams.
Can I Create a 5-Point Likert-Scale Questionnaire Online Instead of Using Word or PDF?
Yes. You can create a 5-point Likert-scale questionnaire online instead of relying on Word or PDF files, then share its link, collect responses and analyse the results more easily. In Porsline, you can begin with a customer satisfaction survey template or an employee satisfaction survey template, then adapt the questions and response options to your survey objective.